

Replicating numbers from Shopify Analytics in your own app or spreadsheet is challenging. Shopify Analytics does a lot of filtering and maths behind the scenes, which makes it hard for developers to get an exact match using the GraphQL API. Discrepancies in filters, sales, taxes, refunds, dates, timezones, and currency conversions quickly add up.
Shopify themselves do not fully explain how their analytics values are calculated. Through extensive testing and API mapping, we've reversed engineered the processes, and share the process below.
Option 1: Using ShopifyQL
ShopifyQL is Shopify's query language, used to create data visualisations and reports in their Analytics page. Every report or graph created in Shopify Analytics has a ShopifyQL query associated with it.
As of October 2025, Shopify has enabled ShopifyQL queries over GraphQL. That means that developers can submit ShopifyQL queries and get the data back exactly as it appears in Shopify Analytics. Unfortunately, there are a few drawbacks.
ShopifyQL Limitations
There are five main limitations to keep in mind:
- Rate limits. Submitting ShopifyQL requests over GraphQL is subject to the usual GraphQL rate limits. Also, there's no way to submit bulk jobs for ShopifyQL requests. If you need to send many requests in a short period, rate limits may cause an issue.
- Historical data limits. Shopify Analytics report granularity and history are limited. For example, hourly sales reports are only accessible for the last 7 days. Some historical data, like inventory levels, is not available beyond 90 days. Session-related metrics are unavailable before October 1, 2022 and Inventory-related metrics cut off on October 1, 2023.
- Limited joins. While ShopifyQL is similar to SQL, your ability to join tables is limited, and controlled by Shopify's query execution engine. Many tables are pre-joined: the
salestable has product information and customer data, but not the data from the sessions leading up to each sale, despite that being available elsewhere. If you need to join fields from tables which cannot be connected (see if they are greyed out in Shopify Analytics), then ShopifyQL's joins will not work. - No external data. ShopifyQL does not connect to other platforms. Despite being able to connect to marketplaces like Amazon via the Shopify Marketplace app, you won't be able to see any of your third-party marketplace sales in Shopify Analytics. Similarly, you can't get in-depth marketing insights because of Shopify Analytics' limited integration with Google, Facebook and other marketing platforms.
- Multiple stores. If you run multiple Shopify stores, you may not be able to combine their data via ShopifyQL. Plus stores (Shopify's highest tier, $2,300/mo) can combine data for some reports as long as stores are in the same Shopify organization. If you are a non-plus customer, or want to join across organizations, you need write custom code merge requests together (or use a dedicated analytics platform like retailQ).
Therefore, avoid ShopifyQL for large scale work, or if you need detailed data. If you're building a powerful dashboard app, ShopifyQL is not suitable.
When to use ShopifyQL
Despite the limitations, ShopifyQL can be a great tool for small, on-demand requests. For example:
- Displaying summary results to your app users. For example, a daily email digest could fetch results via ShopifyQL and send them to users.
- Running a script weekly to identify top selling products and add them to a 'Bestsellers' or 'Rising Stars' collection on your storefront.
- Backend processes, like checking the number of orders each month for a billing tier calculation.
- (Depending on the size of your store) Post-sale processes, like identifying if a customer is a loyal and adding a note to their order. However, if you have many orders, you may run into Shopify's rate limits.
How to use ShopifyQL to replicate results
Get the ShopifyQL Query
Click on an item in your Shopify Analytics dashboard to bring up a detailed view. At the top of the screen, you will see the ShopifyQL query:
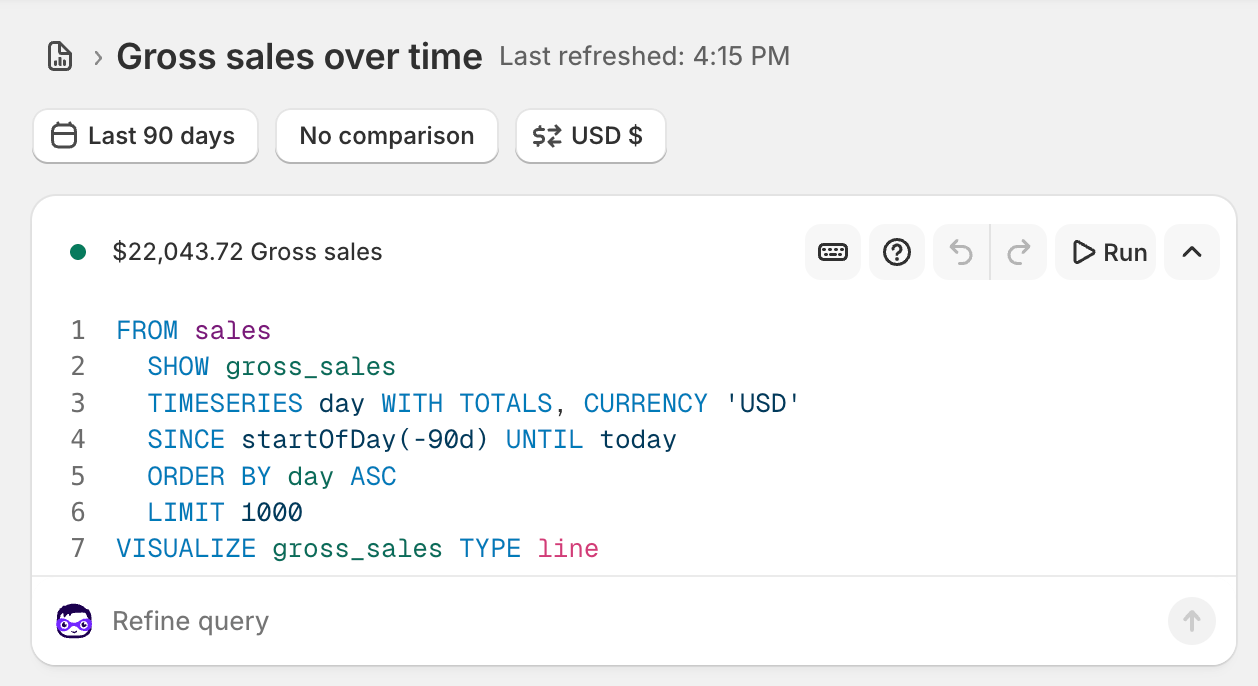
Make sure that you have set date filters correctly: if you have set a fixed date filter, then you query will not auto-update to pull the latest data. Refer to the ShopifyQL API reference to customise your query further.
Submit the GraphQL API request
Note: the read_reports access scope is required to submit ShopifyQL queries over GraphQL. Additionally, you will need approval (via your Shopify Partner 'App Distribution' page) to access any personally identifiable customer data, like emails, names and addresses.
Submit the an API request to the shopifyqlQuery:
1query {
2    shopifyqlQuery(query: "FROM sales SHOW total_sales GROUP BY month SINCE -3m") {
3      tableData {
4        columns {
5          name
6          dataType
7          subType
8          displayName
9        }
10        rows
11      }
12      parseErrors
13    }
14 }- Put the query copied from Shopify analytics into the query parameter between the quotation marks
- Be sure to include
rowsas one of the fieldstableData, otherwise you will not be able to receive the data - Optionally include
columninformation. Refer to the ShopifyqlQueryResponse type in Shopify documentation for the full type spec. - You can use GraphQL variables for the query, in case you want to parametrise it
You should receive the data immediately (it may take a few seconds to process). Again, there is no way to submit a 'bulk' job for a ShopifyQL request. However, you can use LIMIT and OFFSET within your query to set up pagination if you need to extract a large number of rows.
Option 2: Using GraphQL
In many situations, using ShopifyQL is not a viable option. If your your request volume exceeds Shopify's rate limits, or you need to build custom metrics, or merge data with external sources.
To get around the ShopifyQL limitations, you need to re-create the numbers in Shopify Analytics' reports using other data from the GraphQL API. As an example, we will primarily look at replicating sales reports using GraphQL Order data.
Step 1: Select the right fields
The #1 reason for discrepancies is because developers query the Order object's fields, while Shopify Analytics queries the SalesAgreement object.
Using fields directly from the Orders object, like subtotalPriceSet for sales and totalRefundedSet for refunds is wrong, and will often not match Analytics data.
Instead, use the Order agreements field to get SalesAgreements, and then the sales field on each SalesAgreement to get the associated Sales objects.
Sales/Agreements represent intentions to exchange funds, such as when your customers pay you, or when you refund them. For example:
- An order is set up, but unpaid by the customer.
- The next day, the customer pays. Shopify creates a SalesAgreement with the payment date. The SalesAgreement will have multiple Sales objects depending on what the customer bought: one for all products, one for shipping, and one for gift cards.
- A week later, you refund the customer. Shopify will create a second SalesAgreement with the refund information. It will be dated using the refund date, not the order or payment date. Depending on what you refund, there may be multiple Sales items as well: one for the refunded products, one for refunded shipping, etc. These Sales will have negative values, to show the money is returning to the customer.
By combining data from SalesAgreements and Sales you get the information needed to start matching Shopify Analytics numbers.
Fetch the data
This GraphQL query shows how to fetch these nodes for a specific order:
1query {
2    order(id: "gid://shopify/Order/148977776") {
3      id
4      agreements {
5        nodes {
6          id
7          happenedAt
8          sales {
9            nodes {
10              id
11              actionType
12              lineType
13              totalAmount
14              totalDiscountAmountBeforeTaxes
15              totalTaxAmount
16            }
17          }
18        }
19      }
20    }
21  }
Why you need those fields:
| SalesAgreement Field | Note |
|---|---|
| happenedAt | Used as the 'date' field in Shopify Analytics |
| Sales Field | Note |
|---|---|
| actionType | Determines if the sale is for an order (sales) or returns (refunds) |
| lineType | What the line item is for, like shipping, gift cards, or products |
| totalTaxAmount | Distinguishes between gross and net sales/refunds |
| totalAmount | Amount, with tax removed |
| totalDiscountAmountBeforeTaxes | Discount amount. We recommend using totalDiscountAmountBeforeTaxes instead of totalDiscountAmountAfterTaxes to simplify calculations. |
Since Orders are a top-level object, you can use Shopify's Bulk Operations to submit the same query for all orders.
Step 2: Aggregate the data
To aggregate the data correctly, we need to apply exclusions and the correct formulae. The aggregation and exclusions depend on gross, net or total sales/refund values. You need to filter the Sale actionType and lineType fields, and sum different fields:
| Metric | actionTypes included | lineTypes included | Formula |
|---|---|---|---|
| Gross Sales | ORDER | PRODUCT | totalAmount - totalTaxAmount + totalDiscountAmountBeforeTaxes |
| Total Sales | ORDER, RETURN | PRODUCT, SHIPPING, ADJUSTMENT, ADDITIONAL_FEE, FEE, DUTY | totalAmount |
| Net Sales | ORDER, RETURN | PRODUCT, ADJUSTMENT, FEE | totalAmount - totalTaxAmount |
| Order Count | ORDER | PRODUCT | Distinct Count of ID. |
| Gross/Total/Net Refunds | RETURN | Same as above | Same as above |
| Gift Cards | Same as above | GIFT_CARD only | Same as above |
Note:
totalAmountexcludes discounts, which is why we have to addtotalDiscountAmountBeforeTaxesto get gross values- Gift cards are completely excluded from sales data and order counts. This is a common issue (for example, if a customer buys only a gift card in their order, Shopify's order count will still be 0)!
Aggregating by date
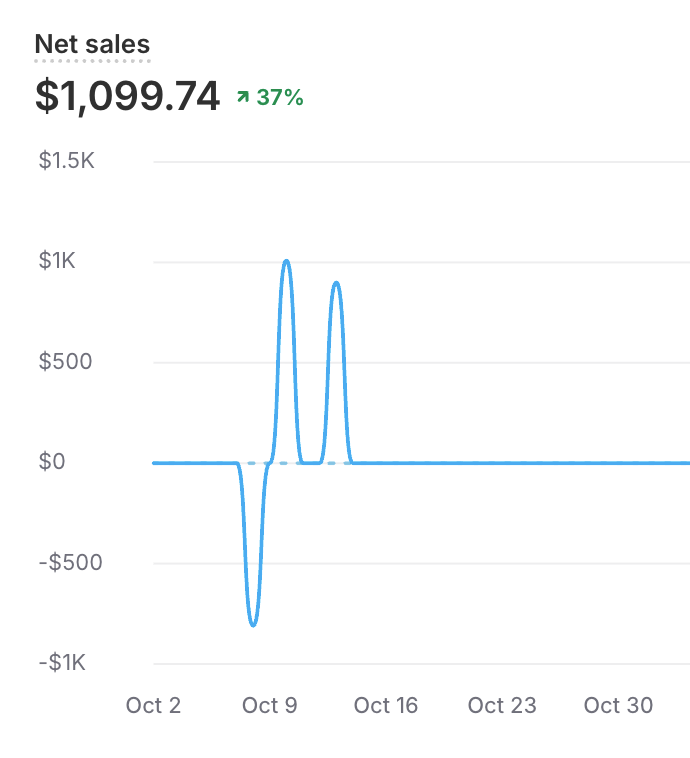
For time-based aggregations, use the SalesAgreement happenedAt date instead of the Order createdAt date. In Shopify Analytics, an Order is modelled as a series of sales, not a one-time transaction. This is why net or total sales can be negative: if a customer buys $100, and refunds it 7 days later, you will see sales of $100 on day 1, and -$100 on day 7.
This is the standard, accounting-friendly methodology for modelling sales in commerce. retailQ gives you the option to view sales both ways (for example, many stores want to know the true impact of Black Friday after all refunds, instead of seeing a lag effect dilute their holiday season revenues).
Example SQL Queries
Here is an example SQL query which can be used to replicate Net Sales by day. This could be used if you already have a data warehouse:
1SELECT
2  DATE_TRUNC(day, sales_agreements.happenedAt) AS sales_date, -- You could truncate this to the hour or week instead
3  SUM(sales.totalAmount - sales.totalTaxAmount) AS net_sales
4FROM sales_agreements
5JOIN sales
6  ON sales_agreements.id = sales.__parent_id -- When using bulk data extractions, Shopify creates the __parent_id field
7WHERE sales.actionType IN ('ORDER', 'RETURN')
8  AND sales.lineType IN ('PRODUCT', 'ADJUSTMENT', 'FEE')
9GROUP BY sales_date
In the query, we join SalesAgreements and Sales together based on the Sales' id. This is necessary because the SalesAgreements table holds the date information (happenedAt) and Sales contains the sales values (totalAmount and totalTaxAmount).
We apply the formula within the SUM aggregation, and apply the filters in the WHERE clause. Refer to the table above for the formula and filters.
To aggregate multiple metrics in the same query, move the filters to a CASE expression:
1SELECT
2  DATE_TRUNC(day, sales_agreements.happenedAt) AS sales_date, -- You could truncate this to the hour or week instead
3  CASE
4    WHEN sales.actionType IN ('ORDER') AND sales.lineType IN ('PRODUCT')
5    THEN SUM(sales.totalAmount - sales.totalTaxAmount + sales.totalDiscountAmountBeforeTaxes)
6    ELSE 0
7  END AS gross_sales,
8  CASE
9    WHEN sales.actionType IN ('ORDER', 'RETURN') AND sales.lineType IN ('PRODUCT', 'ADJUSTMENT', 'FEE')
10    THEN SUM(sales.totalAmount - sales.totalTaxAmount)
11    ELSE 0
12  END AS net_sales
13FROM sales_agreements
14JOIN sales
15  ON sales_agreements.id = sales.__parent_id
16GROUP BY sales_date
Other common issues
- Timezones. Shopify Analytics always displays data in the store's default timezone. However, the Graph API returns timestamps in the UTC timezone. This means that you will need to convert dates back into the user's timezone. Convert the timezone before aggregating to daily/weekly data. Otherwise, you'll experience timezone cutoff problems: an order placed 11PM, December 12 in New York will have a UTC timestamp of 4AM December 13!
- Currency conversion. Shopify uses internal rates to convert any foreign transactions into the store's default currency. They are close to (but don't always exactly match) rates available through the Open Exchange Rates API. Shopify also charge a foreign transaction fee (1.5-3% depending on the currency and your store plan). It is often easiest to get the GraphQL API to return values already in the store currency, with the transaction fee baked in. Be aware this can introduce a small discrepancy with accounting systems.
Step 3: GraphQL objects for other metrics
So far, we've looked at matching sales data with Shopify Analytics. What should you do if you need to match other data, like inventory, fulfillments or web analytics?
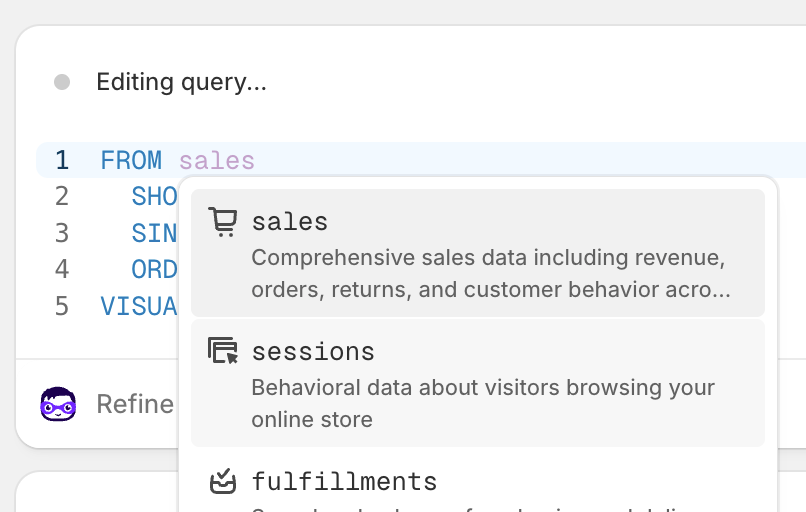
The trick is to look at the table name when editing a ShopifyQL report. Shopify displays a dropdown list of all the available options. Then, search the GraphQL for the corresponding object or table. For example, because metrics like Net Sales or Gross Sales are taken from the sales table instead of orders, we know to look at the Sales GraphQL objects instead of Orders.
Step 3: Web Pixel API for conversion metrics
Session data, which you need to replicate Shopify Analytics reports like conversion rates and funnels, is not available through the GraphQL API.
Instead, use the Web Pixel API, which operates differently. Using that, you can subscribe to Shopify's web analytics events and receive a webhook every time a user creates a session or views a page (see the full reference here). Aggregating these events is straightforward (e.g. sum the number of page view events) to easily match Shopify Analytics reports.
However you cannot access historical data; you'll only receive data from when your app is installed. We suggest backfilling historical data with ShopifyQL queries, or other services like Google Analytics (although GA will not exactly match Shopify's data).